Posts

Showing posts from October, 2018

How to add ,read,insert AUDIO in MATLAB

Image
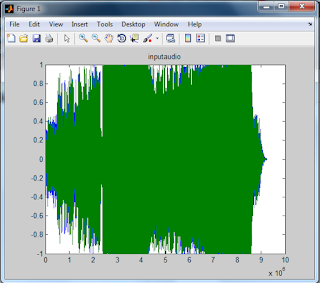
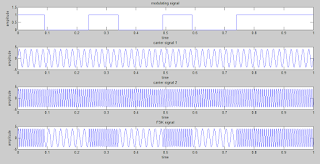
1) Statement of Problem :- Here we are going to see how to add audio in MATLAB. 2) Program :- %% Read audio p=audioread('C:\Users\akshay\Downloads\pi.mp3'); %% Show audio figure(1) plot(p); title('inputaudio') 3) Explanation :- p=audioread('C:\Users\akshay\Downloads\pi.jpg'); In this instruction MATLAB reads the audio from the location which is given by user here i have given the location which is p =audioread(' C:\Users\akshay\Downloads\pi.mp3 '); while giving the location you have to remember some point 1) The must be in  single quotations marks. ex.  'your location' 2) After giving location you must have to give the name of file with its extension which is in this example is pi.mp3. figure(1) This instruction creates the figure window for you. plot(p); This instruction is use to plot  the audio which is given by user. As here the audio which is given by user is assign to the p thats why we write here in bracket plot (

How to add ,read,insert IMAGE in MATLAB

Image
1) Statement of Problem :- Here we are going to see how to add image in MATLAB. 2) Program :- %% Read Image Inputimage=imread('C:\Users\akshay\Downloads\pi.jpg'); %% Show image figure(1) imshow(Inputimage); title('INPUT IMAGE') 3) Explanation :- Inputimage=imread('C:\Users\akshay\Downloads\pi.jpg'); In this instruction MATLAB reads the image from the location which is given by user here i have given the location which is  Inputimage=imread(' C:\Users\akshay\Downloads\pi.jpg '); while giving the location you have to remember some point 1) The must be in  single quotations marks. ex.  'your location' 2) After giving location you must have to give the name of file with its extension which is in this example is pi.jpg. figure(1) This instruction creates the figure window for you. imshow(Inputimage); This instruction is use to display or show the image which is given by user. As here the input image which is given by user is

How to do DEFFIE HELLMAN (DH) USING MATLAB CODE

Image
1. Introduction :- Diffie hellman is a technique which uses symmetric key for encryption and decryption. 2 . Problem Statement :- To generate key K using the Diffie hellman for the given values. 3. Program :- clc; clear all; close all; n=input('Enter value of n:'); g=input('Enter value of g:'); x=input('Enter value of x:'); y=input('Enter value of y:'); A=mod(g^x,n); B=mod(g^y,n); k1=mod(B^x,n); k2=mod(A^y,n); display(k1) display(k2) 4. How to use this code :- Here you have to only copy the code to MATLAB and just run it after that you have to give your values of n,g,x,y . 5. Output  :-                                  C ommand Window                                                   6. Conclusion  - Here we have successfully generate KEY for Deffie hellman using the MATLAB.

How to do ARITHMETIC CODING USING MATLAB CODE

Image
1. Introduction :- Arithmetic coding is a technique which is used for lossy and lossless data compression. Here we have used this coding for generation of tag by knowing the probabilities. 2 . Problem Statement :- To generate TAG using the Arithmetic coding for the given probabilities sequence. 3. Program :- clc; clear all; L=0; U=1; p1=input('enter probability of a='); p2=input('Enter probability of b='); p3=input('Enter probability of c='); sym i; for i=1:1:5  k=menu('select probability','a','b','c');  switch k  case 1  x1=0;  x2=p1;  case 2  x1=p1;  x2=p1+p2;  case 3  x1=p1+p2;  x2=1;  end  Ln=L+((U-L)*x1);  Un=L+((U-L)*x2);  L=Ln;  U=Un; end Tag=(L+U)/2 4. How to use this code :- Here you have to only copy the code to MATLAB and just run it after that you have to give your probabilities values and select sequence from figure window. 5. Output  :-   Figure Window             

How to do CHINESE REMAINDER THEOREM (CRT) USING MATLAB CODE

Image
1. Introduction :- CRT states that below equation having unique solution if moduli are relative prime. x=a1 mod m1 x=a2 mod m2 . . . x=a(n) mod m(n) 2 . Problem Statement :- To generate X using the chinese remainder theorem. 3. Program :- clc; clear all; close all; a1=input('Enter value of a1:'); m1=input('Enter value of m1:'); a2=input('Enter value of a2:'); m2=input('Enter value of m2:'); a3=input('Enter value of a3:'); m3=input('Enter value of m3:'); M=m1*m2*m3 M1=M/m1 M2=M/m2 M3=M/m3 M11=mod(M1,m1) M12=mod(M2,m2) M13=mod(M3,m3) x=mod(((a1*M1*M11)+(a2*M2*M12)+(a3*M3*M13)),M); display (x); 4. How to use this code :- Here you have to only copy the code to MATLAB and just run it after that you have to give values of a1, a2, a3, m1, m2, m3. 5. Output  :-                                   C ommand Window                                                   6. Conclusion  - Here

How to do VERNAM DECIPHERING USING MATLAB CODE

Image
1. Introduction :- It is the technique which is use to cipher or encrypt the data word by using keyword. 2 . Problem Statement :- To decipher the given word by using vernam deciphering. 3. Program :- %vernam decipher clc; clear all; close all; a1=['a','b','c','d','e','f','g','h','i','j','k','l','m','n','o','p','q','r','s','t','u','v','w','x','y','z']; b1=[0:25]; word='wafg'; code='ratn'; display(word); display(code); for ii=1:length(word)     for jj=1:length(a1)         if word(ii)==a1(jj);             w1(ii)=b1(jj);         end         if code(ii)==a1(jj)            c1(ii)=b1(jj);         end     end end newcode=w1-c1; for ii=1:length(newcode)     if(newcode(ii)<0);         newcode(ii)=newcode(ii)+26;     else         continu

How to do VERNAM CIPHERING USING MATLAB CODE

Image
1. Introduction :- It is the technique which is use to cipher or encrypt the data word by using keyword. 2 . Problem Statement :- To cipher the given word by using vernam ciphering. 3. Program :- %vernam cipher clc; clear all; close all; a1=['a','b','c','d','e','f','g','h','i','j','k','l','m','n','o','p','q','r','s','t','u','v','w','x','y','z']; b1=[0:25]; word='famt'; code='ratn'; display(word); display(code); for ii=1:length(word)     for jj=1:length(a1)         if word(ii)==a1(jj);             w1(ii)=b1(jj);         end         if code(ii)==a1(jj)            c1(ii)=b1(jj);         end     end end newcode=w1+c1; for ii=1:length(newcode)     if(newcode(ii)>25);         newcode(ii)=newcode(ii)-26;     else         continue  

How to do Phase Shift Keying (PSK) using MATLAB

Image
1. Introduction :- In PSK the phase of the carrier signal is changes with respect to the change of digital data. when the signal changes from 1 to 0 or vice versa the the phase of carrier signal change by 180 degree. 2 . Problem Statement :- To generate the PSK wave using MATLAB and plot the carrier ,square pulse and PSK signal on figure window. 3. Program :- clc; clear all; close all; f1=input('frequency of carrier='); f2=input('frequency of square wave='); a=3; t=0:0.001:1; x=a*sin(2*pi*f1*t); y=square(2*pi*f2*t); z=x.*y; subplot(3,1,1); plot(t,x); xlabel('time'); ylabel('amplitude'); title('carrier signal'); subplot(3,1,2); plot(t,y); xlabel('time'); ylabel('amplitude'); title('square wave'); subplot(3,1,3); plot(t,z); xlabel('time'); ylabel('amplitude'); title('PSK signal'); 4. How to use this code :- Here you have to only copy the code to MATLAB and jus

How to do Frequency Shift Keying (FSK) using MATLAB

Image
1. Introduction :- In FSK the modulated signal is shifted in steps that is from one frequency to another frequency depending on the digital pulse.If the higher frequency is used for represent the data '1' then lower frequency is used for represent '0'. 2 . Problem Statement :- To generate the FSK wave using MATLAB and plot the carrier ,square pulse and FSK signal on figure window. 3. Program :- clc; clear all; close all; t=0:0.0001:1; fm=4; m=[ones(1,900) zeros(1,1500) ones(1,1000) zeros(1,1500) ones(1,1000) zeros(1,1500) ones(1,2601)]; subplot(4,1,1); plot(t,m); axis([0 1 0 1.5]) title('modulating signal'); xlabel('time'); ylabel('amplitude'); fc1=input('enter the value of carrier 1='); fc2=input('enter the value of carrier 2='); c1=4*sin(2*pi*fc1*t); c2=4*sin(2*pi*fc2*t); subplot(4,1,2); plot(t,c1); title('carrier signal 1'); xlabel('time'); ylabel('amplitude'); subplot(4,1

How to do Amplitude Shift Keying (ASK) using MATLAB

Image
1. Introduction :- Amplitude Shift Keying(ask) is the simplest method of modulation. the amplitude of carrier wave varies with respect to the amplitude of square pulse. The of achieving of ASK is to switching OFF the carrier when the pulse amplitude is '0' and switching ON when carrier when the pulse amplitude is '1'.this method is called as ON-OFF keying. 2 . Problem Statement :- To generate the ASK wave using MATLAB and plot the carrier ,square pulse and ASK signal on figure window. 3. Program :- clc; clear all; close all; f1=input('Enter the frequency of carrier='); f2=input('Enter the frequency of pulse='); a=3; t=0:0.001:1; x=a*sin(2*pi*f1*t); u=a/2*square(2*pi*f2*t)+a/2; v=x.*u; subplot(3,1,1); plot(t,x); xlabel('time'); ylabel('amplitude'); title('carrier'); grid on; subplot(3,1,2); plot(t,u); xlabel('time'); ylabel('amplitude'); title('square pulse'); grid on; subp

Vehicle Number Plate Detector using MATLAB

Image
1. Introduction :- MATLAB (matrix laboratory) is a multi-paradigm numerical computing environment and priority programming language developed by Math Works. MATLAB allows matrix manipulation ,plotting of functions and data ,implementation of algorithm creation of user interfaces, and interfacing with programs written in other languages, including C, C++, Java, Fortran and Python. Vehicles in each country have a unique license number, which is written on its license plate. This number distinguishes one vehicle from the other, which is useful especially when both are of same make and model. An automated system can be implemented to identify the license plate of a vehicle and extract the characters from the region containing a license plate. The license plate number can be used to retrieve more information about the vehicle and its owner, which can be used for further processing. Such an automated system should be small in size, and portable. 2 . Problem Stat