How to do Phase Shift Keying (PSK) using MATLAB
1.Introduction:-
2.Problem Statement:-
To generate the PSK wave using MATLAB and plot the carrier ,square pulse and PSK signal on figure window.
3.Program:-
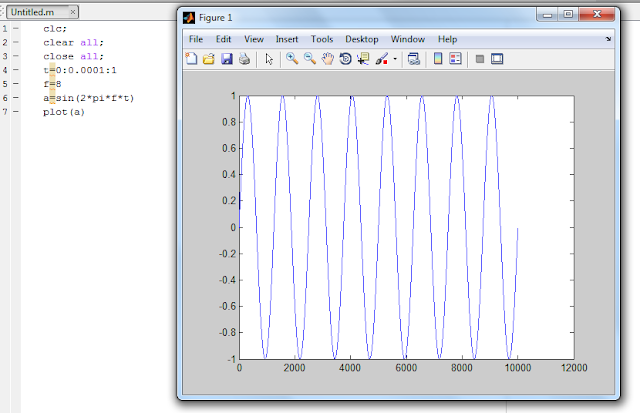
clc;
clear all;
close all;
f1=input('frequency of carrier=');
f2=input('frequency of square wave=');
a=3;
t=0:0.001:1;
x=a*sin(2*pi*f1*t);
y=square(2*pi*f2*t);
z=x.*y;
subplot(3,1,1);
plot(t,x);
xlabel('time');
ylabel('amplitude');
title('carrier signal');
subplot(3,1,2);
plot(t,y);
xlabel('time');
ylabel('amplitude');
title('square wave');
subplot(3,1,3);
plot(t,z);
xlabel('time');
ylabel('amplitude');
title('PSK signal');
4.How to use this code:-
Here you have to only copy the code to MATLAB and just run it and after this you have to give the value of frequency of carries wave and square pulses.
5.Output :-


6.Conclusion -
Here we have successfully plot the PSK using the MATLAB.
For any question contact me on: akshayadivarekar777@gmail.com
In PSK the phase of the carrier signal is changes with respect to the change of digital data.
when the signal changes from 1 to 0 or vice versa the the phase of carrier signal change by 180 degree.
when the signal changes from 1 to 0 or vice versa the the phase of carrier signal change by 180 degree.
2.Problem Statement:-
To generate the PSK wave using MATLAB and plot the carrier ,square pulse and PSK signal on figure window.
3.Program:-
clc;
clear all;
close all;
f1=input('frequency of carrier=');
f2=input('frequency of square wave=');
a=3;
t=0:0.001:1;
x=a*sin(2*pi*f1*t);
y=square(2*pi*f2*t);
z=x.*y;
subplot(3,1,1);
plot(t,x);
xlabel('time');
ylabel('amplitude');
title('carrier signal');
subplot(3,1,2);
plot(t,y);
xlabel('time');
ylabel('amplitude');
title('square wave');
subplot(3,1,3);
plot(t,z);
xlabel('time');
ylabel('amplitude');
title('PSK signal');
4.How to use this code:-
Here you have to only copy the code to MATLAB and just run it and after this you have to give the value of frequency of carries wave and square pulses.
5.Output :-
Figure Window

Command Window

6.Conclusion -
Here we have successfully plot the PSK using the MATLAB.
For any question contact me on: akshayadivarekar777@gmail.com


Comments
Post a Comment