How to plot AM (Amplitude Modulated) signal using MATLAB
1.Introduction:-
2.Problem Statement:-
To plot AM(Amplitude Modulated) signal using MATLAB.
3.Program:-
clc;
clear all;
close all;
t=0:0.0001:1;
em=5;
ec=5;
fm=10;
fc=100;
a=em*sin(2*pi*fm*t);
subplot(5,1,1);
plot(t,a);
xlabel('time');
ylabel('amplitude');
title('modulating signal');
b=ec*sin(2*pi*fc*t);
subplot(5,1,2);
plot(t,b);
xlabel('time');
ylabel('amplitude');
title('carrier signal');
m=0.5
ec=em/m;
c=ec*(1+m*sin(2*pi*fm*t)).*sin(2*pi*fc*t);
subplot(5,1,3);
plot(t,c)
xlabel('time');
ylabel('amplitude');
title('under modulated signal');
m=1
ec=em/m;
c=ec*(1+m*sin(2*pi*fm*t)).*sin(2*pi*fc*t);
subplot(5,1,4);
plot(t,c)
xlabel('time');
ylabel('amplitude');
title('perfect modulated signal');
m=2
ec=em/m;
c=ec*(1+m*sin(2*pi*fm*t)).*sin(2*pi*fc*t);
subplot(5,1,5);
plot(t,c)
xlabel('time');
ylabel('amplitude');
title('over modulated signal');
4.How to use this code:-
Here you have to only copy the code to MATLAB and just run it and on figure window all signal will appear.
5.Output :-

6.Conclusion -
Here we have successfully plot the AM (Amplitude Modulated) using MATLAB .
AM wave is defined as the amplitude of carrier is varies with respect to the modulating signal.
These signals are used in AM transmission and reception.
These signals are used in AM transmission and reception.
To plot AM(Amplitude Modulated) signal using MATLAB.
3.Program:-
clc;
clear all;
close all;
t=0:0.0001:1;
em=5;
ec=5;
fm=10;
fc=100;
a=em*sin(2*pi*fm*t);
subplot(5,1,1);
plot(t,a);
xlabel('time');
ylabel('amplitude');
title('modulating signal');
b=ec*sin(2*pi*fc*t);
subplot(5,1,2);
plot(t,b);
xlabel('time');
ylabel('amplitude');
title('carrier signal');
m=0.5
ec=em/m;
c=ec*(1+m*sin(2*pi*fm*t)).*sin(2*pi*fc*t);
subplot(5,1,3);
plot(t,c)
xlabel('time');
ylabel('amplitude');
title('under modulated signal');
m=1
ec=em/m;
c=ec*(1+m*sin(2*pi*fm*t)).*sin(2*pi*fc*t);
subplot(5,1,4);
plot(t,c)
xlabel('time');
ylabel('amplitude');
title('perfect modulated signal');
m=2
ec=em/m;
c=ec*(1+m*sin(2*pi*fm*t)).*sin(2*pi*fc*t);
subplot(5,1,5);
plot(t,c)
xlabel('time');
ylabel('amplitude');
title('over modulated signal');
4.How to use this code:-
Here you have to only copy the code to MATLAB and just run it and on figure window all signal will appear.
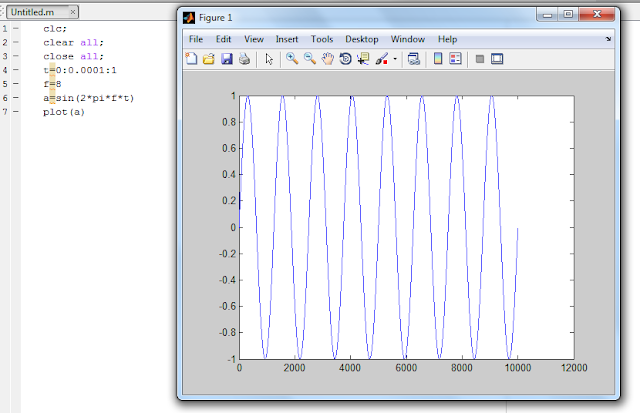
5.Output :-
Figure Window

6.Conclusion -
Here we have successfully plot the AM (Amplitude Modulated) using MATLAB .


Comments
Post a Comment