Basic Instruction of MATLAB
1) clc (clear command window):-
syntax : clc
description :-
when user writes clc in program or in command window then the content of command window will be cleared. After using the clc user can not undo or get back the erased data of command window.
2) clear all :-
syntax : clear all
description :-
when user writes clear all in program or in command window then the content of workspace will be cleared. After using the clear all user can not undo or get back the erased data of workspace.
3) close all :-
syntax : close all
description :-
when user writes close all in program or in command window then the some window such as figure window will be closed. After using the close all user can not undo or get back the closed window.
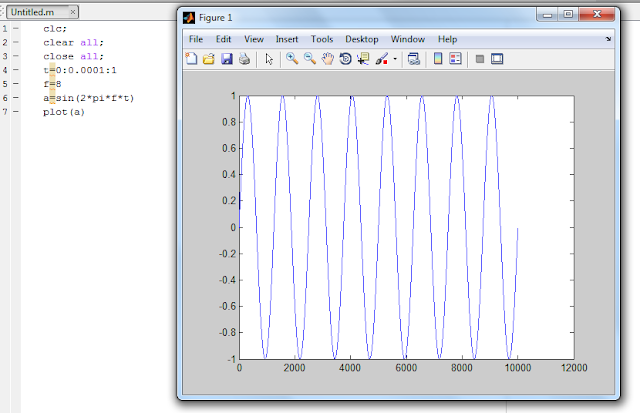
4) plot:-
syntax : plot(a)
description :-
This command is used to plot some waves and some data. This command plot the data or wave in the x-y plane.
Example:-
4) subplot:-
syntax : subplot(r,c,p)
description :-
This command is used to plot multiple things in single figure window. It divides the figure window in to multiple parts.
As per the syntax at the place of r user have to write the maximum no. of the rows,
at the place of c user have to write the maximum no. of the columns,at the place of p user have to write the position of the figure.
Example:-

5) title:-
syntax : title('Enter the title')
description :-
This command is used to give the title to the figure
As per the syntax at the place of Enter the title user have to write their title.
Example:-

6) xlabel:-
syntax : xlabel('Enter the label')
description :-
This command is used to give the label to the x-axis
As per the syntax at the place of Enter the label user have to write their label.
Example:-

7) ylabel:-
syntax : ylabel('Enter the label')
description :-
This command is used to give the label to the y-axis
As per the syntax at the place of Enter the label user have to write their label.
Example:-

8) stem:-
syntax : stem(a)
description :-
This command is used to plot some waves and some data in digital format. This command stem the data or wave in the x-y plane.
Example:-

syntax : clc
description :-
when user writes clc in program or in command window then the content of command window will be cleared. After using the clc user can not undo or get back the erased data of command window.
2) clear all :-
syntax : clear all
description :-
when user writes clear all in program or in command window then the content of workspace will be cleared. After using the clear all user can not undo or get back the erased data of workspace.
3) close all :-
syntax : close all
description :-
when user writes close all in program or in command window then the some window such as figure window will be closed. After using the close all user can not undo or get back the closed window.
4) plot:-
syntax : plot(a)
description :-
This command is used to plot some waves and some data. This command plot the data or wave in the x-y plane.
Example:-

4) subplot:-
syntax : subplot(r,c,p)
description :-
This command is used to plot multiple things in single figure window. It divides the figure window in to multiple parts.
As per the syntax at the place of r user have to write the maximum no. of the rows,
at the place of c user have to write the maximum no. of the columns,at the place of p user have to write the position of the figure.

5) title:-
syntax : title('Enter the title')
description :-
This command is used to give the title to the figure
As per the syntax at the place of Enter the title user have to write their title.
Example:-

6) xlabel:-
syntax : xlabel('Enter the label')
description :-
This command is used to give the label to the x-axis
As per the syntax at the place of Enter the label user have to write their label.
Example:-

7) ylabel:-
syntax : ylabel('Enter the label')
description :-
This command is used to give the label to the y-axis
As per the syntax at the place of Enter the label user have to write their label.
Example:-

8) stem:-
syntax : stem(a)
description :-
This command is used to plot some waves and some data in digital format. This command stem the data or wave in the x-y plane.
Example:-

Comments
Post a Comment